
This post is the written version of a talk for the ASA National Scientific Congress in Adelaide in 2018. A big shout out goes to Justin Skowno for the assistance with this one.
Most anaesthetists don’t mind if things are kept simple. If we hear hooves we mostly look for horses. Not zebras. Or monkeys riding zebras.
If we’re in the water and we hear animal noises we don’t assume it’s this …

Terrifying water pig there.
After all Occam’s razor has the one blade. Not four with a moisturising strip.
When it comes to monitors we also want them to be pretty simple. Monitors should:
- Measure something useful.
- Show it to us in a useful way.
- Help us do something useful for the patient.
Most of our regularly used monitors (pulse oximetry, capnography, ECG, agent monitoring and blood pressure) do this pretty comfortably.
The gap is measuring whether the perfusion to the tissues is adequate. Which is where near-infrared spectroscopy (that’s NIRS from here onwards) tissue oximetry might leap that gap.
And that’s why every single person is absolutely already using it in their theatre, right?
No?
Oh. Oh, I see.
In that case maybe this post can try to cover where this tech has got to, and how we might get it to hit those 3 targets in the bullet points.
Old Tech
I’m told by people who were there that 1976 was pretty great. It was certainly busy for a researcher called Franz Jöbsis because in 1977 he was publishing some pretty interesting work. Because while George Lucas was busily showing moviegoers ‘A New Hope’ and John Travolta caught ‘Saturday Night Fever’, Franz was transilluminating the heads of cats.
In doing so he was modifying the Beer-Lambert equation to cope with the many-varied nature of the feline cerebral tissues and detecting the amount of light from the near-infrared spectrum (700-1300 nm) that would make it to the other side, despite the pesky absorption efforts of chromophores like oxy- and deoxyhaemoglobin, cytochromes and a variety of other smaller influences.
And once he’d figured out some of the details he was able to derive information about how much oxygen was being delivered and the balance of its use, as well as tracking some of the activities of the mitochondria along the way (thanks to that cytochrome bit).
I assume he was working up to detecting the sociopathic bit of the feline brain but I just didn’t have time to chase down that rabbit hole.
So if the tech came about in 1977, why haven’t we already figured out what it’s good for?
Assumptions and Challenges
There were a lot of things to solve along the way to bring it to ‘absolute oximetry’ which is what the manufacturers advertise to us now.
For starters you need to resolve the absorption and scattering behaviour of multiple different wavelengths of light to be able to rapidly put it all together to give ‘absolute’ oximetry (which really is rapidly calculated relative oximetry seeing as there isn’t really a true gold standard and all of the manufacturers get there a different way).
Then of course there’s the problem that most people have a brain bigger than a cat. This means you can’t just shine the light across, you have to use the bit that is reflected back. And as much as you might like to imagine a beautiful shining arc of a photon passing through the tissues, it’s more like a bouncing pinball.
Each system out there figures out that path length of the imaginary photon slightly differently and deals with the attenuation slightly differently. They then tend to do it again for ‘the imaginary shallower photon’ which represents ‘the contaminating bit we’re not interested in that we also have to exclude’.
Phew. Sounds tricky.
Add in getting it to the right size, coping with ambient light and making everything not cost bisquillion dollars (it’s more like a cool zillion) and it’s taken a while to get somewhere useful.
And somewhere useful for now is something like “physiology rules”.
Finding Normality and Waving the Flags
Where NIRS tissue oximetry does pretty well is in helping us understand normal, and maybe acting as a flag for significant changes, or a parameter with associations.
How about a few examples of normal?
Well Michelet et al. published work in 2015 having looked at 69 kids aged 3 months or less and looked for the incidence of cerebral desaturation associated with hypotension. The good news was that if you kept your blood pressure within 20% of the baseline, there was < 10% chance that you’d see cerebral desaturation. Reassuring stuff.
Rhondali et al have published a few bits of work in a similar theme but left us with a specific blood pressure target. In kids under the age of 6 months there seemed to be maintenance of cerebral saturations as long as you stayed above a mean arterial pressure (MAP) of 33 mmHg. This went up to 43 mmHg in the over 6 month age group (the upper limit for inclusion was 2 years old).
So even before we go into active use of these devices, they’ve revealed physiological principles we can apply to any infant or neonate we might be looking after, even if we can’t get our hands on the NIRS oximeter itself.
Work from Olbrecht, Skowno et al published earlier this year is likewise pretty reassuring. In 453 neonates having surgery at a range of institutions, significant cerebral desaturation was rare during anaesthesia. This was true even when the arterial pressure was low.
Only 6% had a moderate cerebral desaturation (over 3 minutes at a level 20% below baseline, or with an absolute value of 50-59%) and only 1% had a severe cerebral desaturation (a fall of over 30% from baseline or an absolute value under 50%). We’re talking very low rates of dodgy events here.
Add this to the fact that in kids under 10 kg having heart surgery, cerebral and somatic NIRS can be used in a way that correlates well with both systolic index and central venous oxygen saturation, and the role of NIRS as a monitor of physiology and figuring out what is normal only grows.
There are also a range of associations. Use of cerebral oximetry during deep hypothermic circulatory arrest appears to be associated with better outcomes. Significant desaturation episodes in the period of rewarming while on cardiopulmonary bypass or in that phase after weaning is associated with cerebral injury. Desaturation episodes in paediatric cardiac surgery appear to be associated with lesions later seen on cerebral imaging.
And in kids with hypoplastic left heart syndrome, Hoffman et al have shown that being able to run cerebral and somatic NIRS allows you to demonstrate associations with early mortality and need for ECMO.
All of this gives you the hope that you’ll be able to pick up the red flag then change treatment to influence that long-term picture.
But that’s just not where we’ve got to. In particular we just haven’t seemed to have the time to show that changing your care based on your findings on cerebral oximetry results in difference in outcomes. In adults, Rogers et al trialled intervening in an algorithmic fashion when those NIRS values dropped in cardiac cases. It should make sense. Sats go down, brain-saving steps are taken, brain gets happy.
Across 3 cognitive domains they couldn’t show a change in outcome. A Cochrane review in 2016 likewise couldn’t show a difference in mortality, major morbidity, red cell usage or general resource use.
Well bugger.
The thing is pulse oximetry didn’t show huge difference sin outcome befoe we made it standard. So are we being unreasonable in demanding something useful of NIRS first?
Wait, that sounded bad. I guess the question is, how do we try and use this promising physiology monitor in a clinical setting. And does something need to change first?

Where next then?
Looking for Change
There are probably a few things that need to happen to make these monitors more useful.
- The monitors probably need to change.
- The way we display that info probably needs to change.
- We probably need to remember how to use a monitor.
The Tech
So what can we expect from the technology. Well the first thing to recognise is that people are still looking at the physiology bit. The more we understand about the physiology and what the monitors are showing us, the closer we’ll get to optimal use of these systems.
It might also be that asking the monitors to be useful while showing us single parameters and trying to piece it together might not be all they are capable of. It might just be that we really need to start delving into the interaction between the different parameters, how the tissue oximetry is shifting with respect to oxygenation, haemodynamics and CO2that will really start showing the dynamic state in a vascular bed. Of course that might need some processing. We’ll get back to that.
The other thing you can expect to see is measurement at the mitochondrial level. After all way back in the day, Jöbsis was already looking at cytochrome oxidase as a potential target. It’s possible, it’s just difficult. Plus the tech has always been uneasy.
Well people are working on this and in particular a crew from University College London led by Ilias Tachtsidis is reducing the complexity of the kit. Once we are seeing what is happening with utilisation of the stuff of life at a mitochondrial level things could get pretty interesting.
How we see it
The way we see that information also probably matters. I mean, depending on who you read we spend between 20% (Charabati et al) and 66% (Kiefer and Hoeft) looking at those monitors.
Like most of our monitors, NIRS oximetry is displayed as a single sensor, single indicator parameter. They add a time series (the trace bit) but ultimately there is a sensor, and it displays a number and then we rely on the clinician to put that together.
The problem with this approach is that we already have a lot of monitors. Again if you look at the review from Kiefer and Hoft we can probably put about 7 pieces of information together in steady state. Load us up with other work to do though and that number drops. Quickly.
We’re not going to ditch pulse oximetry (or the tone that goes with it) or blood pressure or ECG or capnography or agent monitoring. So when you add auditory signalling we’re already at 6 streams. How will you go with two more?
So the way we display NIRS oximetry might need looking at. There is some work out there suggesting that representing observations with shapes (and maybe with colours, or arrows, or changing shapes) might allow you to respond to a change more rapidly. This makes sense particularly if you’re trying to show how NIRS interacts with the other parameters.
What we don’t know yet is if a particular graphical display is preferable. It’s a foreseeable thing that might help us assimilate the extra bits of data we’re seeing though.
The other option out there, particularly with alarms, is to try and get us to use other senses. It might just be that to start being able to pay attention to alarm settings we need the monitor to give us a sensory signal that isn’t just visual. Something like a changing sound (but the changing pulse ox tone already gives us that) or some sort of trigger of touch.
Whatever happens, just adding streams beyond what we can assimilate isn’t going to help us use these monitors clinically.
How we react
The other key thing is that we need to remember how we use monitors. It’s pointless to rely on us assimilating info if we don’t pay attention to how we respond to those monitors.
There’s a bunch of useful work from Sanderson (with others like the amazingly named Seagull) that tells us a heap about how we respond when confronted with monitoring changes. We know that we tend to ignore alarms at induction and emergence and reset our targets mentally during maintenance.
We know that the way we respond is driven by the targets we’ve set ourselves for the case as well as the trigger of an alarm telling we’re outside expected limits.
We know that after 20-30 minutes of a task that needs sustained attention, we get bored and our vigilance drops.
All of these factors should tell us a bit about how we need to treat all monitors, not just NIRS.

This bit is tricky.
There are also a few obvious things that influence whether or not our attention will be captured by a monitor. The 3 big potholes are:
- Sometimes we look at the monitor but don’t really process enough to register what it means.
- Sometimes we just plain ignore things because we’ge decided in advance what fits our picture of ‘relevant for this situation’.
- Sometimes we’re doing clever things with our brain and we don’t want to quit it so we avoid paying attention to the monitor.
That’s right, fear of abandonment is real. It’s just this time we don’t want to abandon our complex brain working.
That’s OK, the Robots Will Save Me
Now a subset of people will be thinking ‘but algorithms and processing will save us from all these worries’. Well yes. Maybe. But also no.
Artificial intelligence (AI) is definitely coming. Cool. The thing is that AI has a lot of coaching required before it will be ready to help us. For starters any false assumption, artefact or erroneous interpretation built into the machine learning algorithm will potentially rapidly spiral to a crazy state. This is what has led to famous occurrences like ‘I built this AI to interpret X-rays and all I got was a system that can’t diagnose a pneumothorax without a chest tube already in place’.
See if you build a system that recognises ‘chest drain – pneumothorax’ then every chest drain looks like a pneumothorax and no chest drain = no pneumothorax. That’s a little bit of a simplification but it kind of holds.
The other thing is it’ll take longer for AI to figure out what is happening clinically. We’re still a way off that rather vital bit being incorporated into the algorithms.
So tech is coming. But it’s something we’ll work with, rather than throwing burning pitchforks or the fairies holding them at.
Getting to the Clinical Bit
So after all of that how do we respond clinically.
Well I’d suggest that to make sense of this trace:

We should:
- Clearly set our starting point.
- Set up the frame; and,
- Circle back.
This just means that the first thing we should do is set really clearly in our mind where we start. It’s almost like the home page we’ll always refer back to.
In this case that’s the patient and the situation we’re in. Understanding the physiology we’re expecting to see helps us interpret how we’re going along the way. It’s also a reminder that when things change, our first step should be to refer back to the patient and what the surgeons are doing so we can figure out what clinical correlates might apply to what we’re seeing on the monitor.
The next step is to set up the frame.
We know we’ll treat alarms and parameters differently at induction, maintenance and emergence. So make a conscious choice to do that.
If you get an initial baseline great. But definitely once you’re under way stop and take sense of where your cerebral oximetry sits, and pay attention to the oxygenation, ventilation, and haemodynamics at that time.
Now in the context of this operation, what are you happy to see over the next phase of the operation? Where are your 20% limits?
If you know what they are, maybe even set those as your alarms.
And finally, circle back. Don’t just trudge forwards, take a look around to make sure you’re still where you expect to be.
Part of this is a regular check in (at around that 20-30 minute mark) in steady state. Reset and refresh.
And if you see a change, you circle back to check in with that starting point and your frame. Are you where you meant to be? Did the patient change? Did the surgeon do something?
The Actual Trace Bit
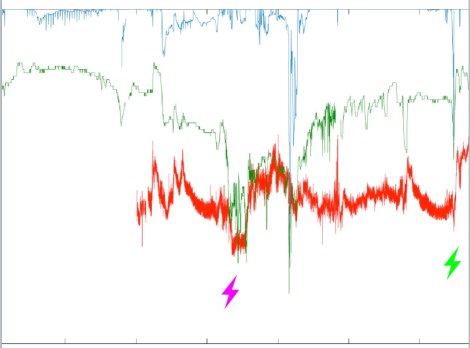
Now let’s look at that trace which is the start of an anaesthetic for a 5 month old having a bit of lung taken out with the clever cameras. Note that it’ a little different to what you’d actually get because I’ve combined saturations, cerebral saturations (the green one) and invasive blood pressure on the same thing.
I’ve noted 3 specific points in that trace.
Lightning bolt number 1 shows us something you should find reassuring – you start your anaesthetic and cerebral saturation immediately picks up. This is the anaesthetic margin you just bought by dropping cerebral metabolic consumption of oxygen. Look at all that wriggle room.
Just as well because you get to point 2. Now we don’t have the invasive blood pressure at this point (this is because it was non-invasive territory at this point) but what you see is a primary oxygenation event.
So the process says ‘I have a kid who exchanges gas OK (trust me on that one) but they’ve had a primary desaturation event. Does this make sense?’
Well the bit I know but that you don’t (but you’re about to, wait for it) is that this is the point where the patient was disconnected from the ventilator to position them on their side.
Phew. It matches the clinical state.
Point 3, well that’s slightly different. The patient’s saturations have been falling. Something makes them go up, the cerebral saturations follow and then blood pressure falls.
So we’d need to go back to the patient. The first bit could be a sustained recruitment (saturations go up, blood pressure responds up a bit initially but then falls while sustained). It does go on a bit though and that might be more like when incision happened (because blood pressure also went up and then everything starts falling.
The key point is that this particular point I can’t tell you exactly what was going on with the patient and that leaves the monitoring unmoored from my anchoring point. Physiology without the clinical bit isn’t enough.
The Actual Next Trace Bit
OK. What about this where the whole trace for the case emerges…
Well that first mark is a primary haemodynamic event. The saturations have been a little challenging in this patient having one lung ventilation. At this point though, the saturations keep bouncing around in the range they’ve been operating in.
What changes is a precipitous fall in blood pressure and the cerebral saturations match it. That rule again? Look back at the patient and where things are now that you’ve spotted this is a big change to the expected.
It just so turns out that this changed just before the surgeon mentioned that whole blood vessel they wished they hadn’t cut. What you see afterwards is the recovery happening as the surgeon did the magic ‘stop bleeding’ moves, and the anaesthetist dealt with the blood pressure and added a transfusion.
And that final one ? That’s the bit where the tube comes back to the mid-trachea (after one lung ventilation created by endobronchial ventilation) and after transiently dropping the blood pressure and saturations as the suction occurred (but a moment’s interruption) and things re-inflated, you’re back in the anaesthetic bonus zone.
What did we ask for? Measurement of something useful. Display in a way we can use (getting there) and an ability to respond meaningfully.
We’re a long way along that road.
The Wrap
After all this monitoring remains pretty simple.
All monitors have compromises in the building and learning phase. Cerebral oximetry is no special snowflake in that regard.
Tech in the form of machine learning and AI is on the way. But it’s not going to take us out of the picture any time soon.
And as always it’s not about the tool. It’s about the tool using the tool.
Notes:
OK lots of references went into this. Here are the highest yield ones.
Kiefer N, Hoeft A. Display of information in the operating room. Curr Opin Anesthesiol. 23:772-77.
Sanderson P. The multimodal world of medical monitoring displays. Appl. Ergo. 2006;37:501-12.
Also if you’re interested in starting to think about artificial intelligence, I strongly recommend doing a quick google search for ‘Made by Humans’ which is authored by Ellen Broad. Seriously good read.
Oh, and the images here are all from Unsplash which is very generous with the creative commons stuff. The images here are from Jakob Owens, Blake Cheek and Stefan Cosma.
Now did you get all the way to here?

Pingback: The 2018 Year in Review | Songs or Stories·